
Advanced Analytics DataLab
Unlock access to modeling Big Data in 4 weeks.
Download the OfferPredictive analytics refers to the collective use of statistical algorithms, data mining, machine learning, and predictive modeling to analyze transactional and historical data and forecast future outcomes. Despite sounding like something out of a science fiction novel, the use of predictive analytics can be traced as far back as the 17th century. Predictive analytics as we now know it came about in the 1940s with the invention of the Turing-Welchman Bombe machine and the use of the Monte Carlo simulation by the Manhattan Project.
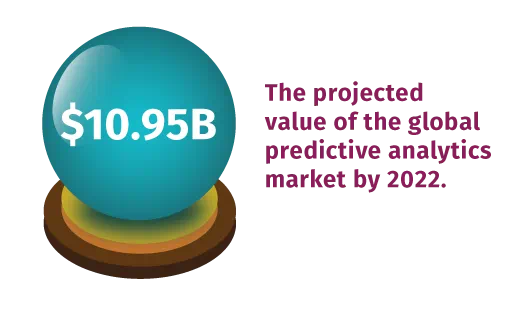
Nowadays, advanced predictive analytics techniques have become part of mainstream business, enabling organizations to leverage big data in order to proactively identify risks and opportunities. Modern technology has made predictive analytics more accessible than ever before, and the global predictive analytics market is projected to reach approximately $10.95 billion by 2022.

In this article, we’ll explore the world of predictive analytics — how it works, various predictive analytics techniques, examples by industry, and more.
How Predictive Analytics Works
In order to leverage predictive analytics, an organization must first define a business goal, whether that’s to increase revenue, optimize operations, or improve customer engagement. Then, using the appropriate software solution, that organization can sort through massive quantities of heterogeneous data, develop predictive analytics models, and generate actionable insights in support of that goal.
From a scientific perspective, predictive analytics is part of a natural progression of understanding and serves the purpose of describing, explaining, and predicting the natural world. It’s a data-driven applied science focused on how a business and its surrounding environment work together as a system. As data is collected, curated, analyzed, and eventually modeled, there are definitive parallels to the way that any science incrementally creates a body of knowledge and builds a foundation for increasingly complex observations and predictions.
Why is Predictive Analytics Important?
Put simply, predictive analytics enables businesses to leverage data to better plan, anticipate, and achieve desired outcomes. Using predictive analytics, organizations can:
- Gain a 360-degree of the customer based on past and present behavior
- Determine which customers are most likely to be profitable
- Optimize marketing campaigns so that they’re more targeted to the individual customer
- Forecast future demand for different products and services
- Engage in more proactive risk management
- Strategically allocate resources in order to generate the greatest returns
- Stay on top of the latest trends and gain a competitive advantage
These are just a few of the many benefits predictive analytics offers.
As an organization builds a data and related forecasting foundation, the returns from its investment in predictive analytics multiply, especially when combined with a corresponding effort to automate workflows developed by its analytics team. Automation reduces the cost of prediction — thereby increasing the frequency with which new predictions can be generated — and enables analytics teams to explore new leads for continuous innovation. A combined effort to implement predictive analytics and automation is a key indicator of maturity for an organization’s business intelligence practice.
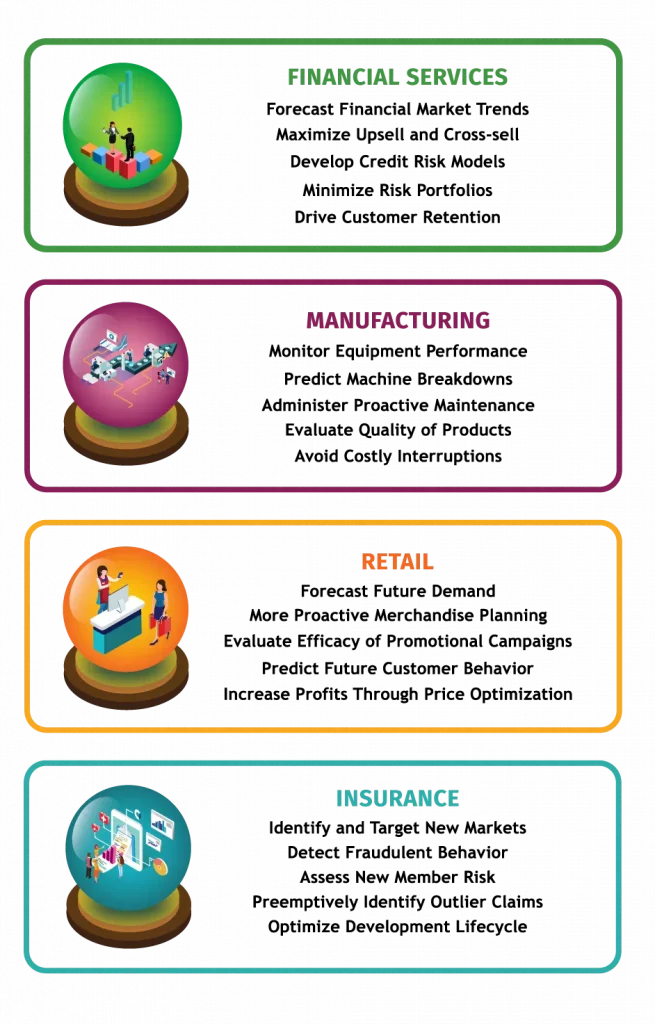
Predictive Analytics Examples by Industry
Organizations across every industry can benefit from implementing predictive analytics. Here are just a few examples of how businesses can benefit:

Predictive Analytics Modeling Techniques
There are five primary categories of predictive analytics techniques; they are as follows:
1. Regression Models
Regression is a statistical method used to identify the quantitative relationship between a dependent variable (that which you’re trying to predict) and a series of independent variables (factors that have an impact on your dependent variable). An organization can mathematically determine the impact of each independent variable on the dependent variable through a process known as regression analysis.
According to Dr. Thomas Redman, a leading authority on data and data quality, regression analysis answers the following questions:
- Which factor matters most?
- Which can we ignore?
- How do those factors interact with each other?
- How certain are we about all of these factors?
There are numerous types of regression within the realm of data science; the two most common are linear regression and logistic regression. Linear regression, which is the simplest form of regression, holds the dependent variable as being constant; as a result, it assumes that the relationship between the dependent and independent variables is linear in nature.
With logistic regression, the dependent variable is binary in nature, whereas the independent variables are either continuous or binary.
Other types of regression include polynomial regression, ridge regression, lasso regression, and elastic net regression.
2. Classification Models
Classification modeling, also known as forecast modeling, is the process by which a software program categorizes new, unlabeled data based on its relevance to known, labeled data — in other words, it categorizes transactional data based on its qualitative relationship to historical data. There are a wide variety of classification models, including decision tree, random forest, multilayer perceptron, and Naïve Bayes; logistic regression is also technically considered a classification model.
3. Outlier Models
Similar to how classification models work with historical data, outlier models — also known as outlier detection or anomaly detection models — work with anomalous data entries within a dataset. Outliers generally fall into one of three categories:
- Point outliers, also known as global outliers, refer to any values that deviate widely from the entire dataset.
- Contextual outliers, also known as conditional outliers, refer to any values that deviate from other data points within the dataset that are presented in the same context.
- Collective outliers refer to any values that deviate from the entire dataset, but whose data points are not anomalous in a global or contextual sense.
Outlier models are typically used to identify behavior that deviates from the norm, making them ideal for fraud detection applications. Popular methods of outlier detection include z-scores, proximity-based models, linear regression models, and information theory models.
4. Time Series Models
Where classification models work with historical data and outliers work with anomalous data, time series models work with data where time is the input parameter. As a result, time series models depict a series of data points indexed in chronological order.
5. Cluster Models
Cluster analysis, also known as clustering, is essentially what its name implies: the process by which data is sorted into discrete groups based on shared attributes. Cluster models are especially useful for direct marketing because they enable organizations to build out targeted marketing campaigns for different customer segments. Common examples of cluster models include connectivity models, distribution models, density models, and neural models.
Predictive Analytics Applications
There are any number of ways organizations can use predictive analytics to optimize business-critical operations; some popular applications include:
- Customer Segmentation: Traditional customer segmentation involves sorting customers into discrete groups based on shared attributes, such as age, gender, and income. Organizations can take this practice a step further and actually predict which segments are most likely to buy certain products based on past purchases by integrating machine learning and artificial intelligence into their existing customer relationship management systems.
- Risk Management: Predictive analytics supports risk identification and management by applying machine learning algorithms to aggregated data sets in order to uncover patterns, correlations, and vulnerabilities, as well as map changes within any given industry. Armed with this information, business leaders can take evasive action to ward off potential operational risk.
- Sales: Organizations can apply machine learning algorithms to purchase data to assess the likelihood that customers will respond to different upsell or cross-sell offers.
- Fraud Detection: According to fraud detection specialist Delena D. Spann, predictive analytics enables fraud examiners to, “take selected sets of variables known to have been involved in past fraud events and place those variables into processes to determine the likelihood that future outcomes or events will or won’t be fraud.” Spann also notes that fraud examiners can leverage predictive analytics to detect everything from insurance fraud to credit card fraud and to establish patterns in high-crime areas.
- Direct Marketing: Predictive analytics allows for greater personalization and more targeted marketing campaigns by evaluating consumer activity across various channels and reviewing customer purchase history and preferences. Organizations can even utilize predictive analytics to determine what language and messaging is most likely to appeal to individual consumers.
- Underwriting: Insurance companies can use predictive analytics to automate components of the underwriting process and derive cognitive insights, thereby allowing for more efficient reviews and more accurate assessments.
- Patient Care: Healthcare providers can leverage predictive data analytics to identify which patients are at risk of developing certain conditions, such as arthritis, diabetes, and asthma, based on previous medical history and family medical history. This enables doctors and other healthcare practitioners to provide more targeted care.
Prescriptive Analytics: The Next Frontier
With predictive analytics well on its way toward becoming common practice, data scientists and businesses alike have started to turn their attention toward the next frontier in data science: prescriptive analytics.
Prescriptive analytics operates on many of the same principles as predictive analytics but takes the concept one step further by using optimization and rule-based techniques to recommend next best actions to ensure predicted outcomes. Prescriptive analytics models are highly flexible and account for major events and trends when generating recommendations.
Predictive Analytics: How to Get Started
Interested in incorporating predictive analytics into your business processes? There are a few steps you’ll need to complete, first.
- Define a Goal: Every predictive analytics project begins by defining a business goal. What is it that you’re trying to predict, and what do you intend to do with that information once you have it?
- Collect Data: Once you have a clear goal or objective in sight, the next step is to start pulling data from various internal and external sources, such as web archives, databases, and spreadsheets. Be sure to cleanse all data prior to analysis.
- Conduct Analysis: Once your data is prepared, you’re ready to run various predictive analytics algorithms against your dataset. Be sure to choose the appropriate techniques based on the intended application — for example, outlier analysis for fraud detection, and so on.
- Create Models: Predictive analytics software solutions make it easy to build analytical models, though it helps to have the support of a data analyst and an IT expert to refine and deploy your models. Preliminary results from a successful proof of concept project can be very promising and may begin to immediately influence business decisions.
- Path to Product: Even the best models won’t bring any value without adoption from users and stakeholders. Costly prototypes should be introduced into decision workflows to evaluate performance, reliability, and ROI. The outcomes of this trial period will be critical when deciding which models to continue refining and pushing towards full automation.
There is, of course, an additional, optional step, one that will streamline the entire process: working with an experienced consulting partner. When analyzing data and developing analytical models, it helps to have the support of an entire team of data scientists and analysts who can help you identify best-in-class solutions and do a significant amount of the work on your behalf.
How One Company Saves $100k Annually Using Predictive Analytics
If the information shared here doesn’t sell you on the power of predictive analytics, let us share one final story with you about how Hitachi Solutions worked on a small predictive analytics project that had a major impact.
When one of our clients, a medical technology company, needed help with reporting, our data science team developed an automated global business intelligence dashboard that managers could use to generate quarterly, monthly, and annual financial reports and forecasts. Using this dashboard, the client was able to eliminate time spent collecting information and completing worksheets and to reduce reporting time from a week to just a matter of hours.
The client’s previous workflow only allowed for visibility into approximately 5,000 stock-keeping units (SKUs) in five international regions (with 20 countries per region) and generated a report just once a month. With this new system, the client can now see daily, unified reports with drill-down detail into the SKU location data at a country-specific level, up to approximately 100,000 SKUs in each of 50 countries. The client was also able to forecast sales quantity and revenue over a 36-month period with greater accuracy. According to an early estimate, this system has enabled the client to generate nearly $100k in annual savings from a single hour of reclamation alone.
This is just one example of how predictive analytics — and Hitachi Solutions — can save organizations valuable time, money, and effort. Contact us today to find out how you can harness the power of the Microsoft platform and leverage predictive analytics to drive digital transformation.


