
Monitoring your Dynamics 365 Finance and Supply Chain implementation to reduce risk and increase performance


Proactive Monitoring and Alerting for Microsoft Dynamics 365 Finance and Supply Chain
Ongoing Oversight for your Dynamics 365 F&O System Health
Watch the On-Demand WebinarMicrosoft Dynamics 365 Finance and Supply Chain can transform the way businesses operate, but we all know the system is not without its performance and ongoing monitoring challenges. Significant resources are required to keep a Dynamics 365 system running efficiently. Issues with performance and slow-running systems are all too common and can be frustrating, time consuming and expensive for internal technical teams.
Yet, take heart! There are a plethora of updated tools and guidance that make it easy to identify bottle necks in your D365 Finance and Supply Chain Operations system. Let’s look first at the common issues we’ve seen and provide some tips on how to approach them. Then, we’ll discuss a few of the tools Microsoft provides to assist organizations in their ongoing performance journey.
Working with batches
Running your business with D365 Finance and Supply Chain typically requires the use of batch jobs to complete routine or periodic tasks in the background, minimizing the need for manual intervention. You are probably creating functional batch jobs that process and execute resource-intensive portions of your business processes, as well as cleanup jobs that remove irrelevant data.
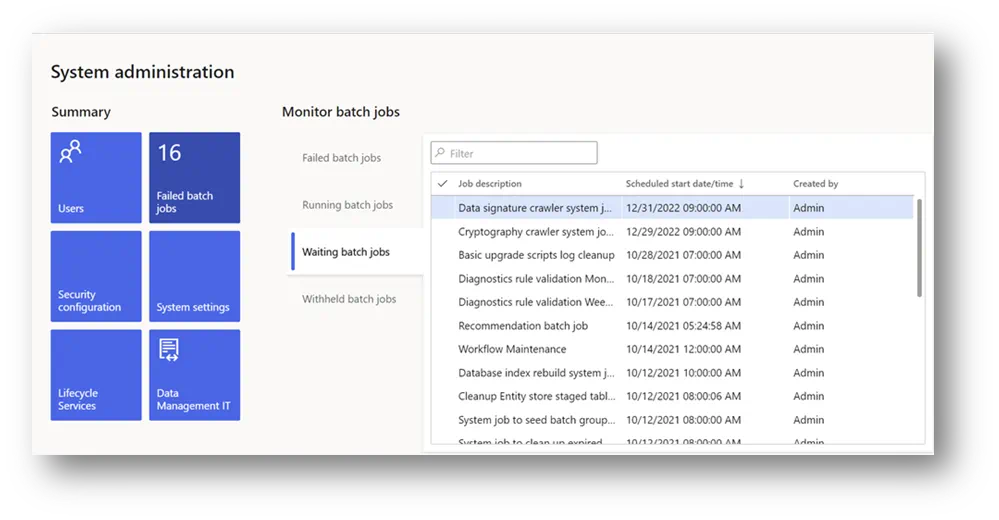
Just about every D365 administrator is familiar with batch malfunctions. For example, one of your users tries to load an invoice or other transaction that was posted overnight, and it’s not there. Or, the batch job has completed, but ended with warnings or errors. The best place to monitor all current batch jobs is through the system administration workspace. Here all failed, running, waiting and withheld batch jobs are shown.
Here’s a few tips and tricks for managing batches:
- Schedule all batches to run during non-business hours
- Regularly check your batch setup, including batch groups and AOS Servers
- Verify the table size for the top 20 tables at least monthly
- Troubleshoot conflicting jobs that use same entity or tables
- Audit workflows for potential slow performing actions
It’s also important to schedule an automatic task to clean up batch job history. We recommend setting up the task to run weekly, but you might need to run the cleanup more or less frequently, depending on your environment. To see your batch job history, go to System Administration > Inquiries > Batch Jobs, switch to the enhanced view, then click on Batch Job History.
Each module in D365 Finance and Supply Chain also has cleanup jobs that can be run manually or via batch to clear redundant data and free database space. Keep in mind, however, that the cleanup actions for business modules affect the business data directly so analyze carefully what data is truly not needed before running the jobs. We recommend that cleanup routines are run monthly. For additional information on cleanup routines in Finance and Supply Chain, check out the Microsoft documentation.
Integrations
Performance delays with integrations may be based on OData. If integrations are using OData, consider that OData is most suited for simple CRUD (Create, Read, Update, Delete) activities. The OData protocol limits transfer to 10,000 records at a time, so for example, if you are running reports with data volumes exceeding 10,000 records, your report will not perform well.
Performance issues with integrating ISV code are also common. This may depend on how current the ISV code is. Be sure to understand the current version state of the ISV or third-party code and test it thoroughly before integrating it.
Microsoft enabled throttling on OData and custom web services integrating with D365 Finance and Supply Chain in June 2021, which will require review by all who are using these integration points. Priority-based throttling uses protection settings to prevent the over-utilization of resources and ensure consistent availability and performance for environments running Finance and Supply Chain applications.
You can set relative priority for the OData and custom service-based integrations, depending on your business-critical need for these integrations. The throttling manager will then honor the priorities set for these requests. You can read more about throttling and OData integration in the Microsoft documentation.
Deadlocks and blocking
From a monitoring perspective, deadlocks and SQL blocking can be frustrating performance issues. Blocking by itself is typical in a healthy system and is only a problem when it becomes excessive or starts degrading business activities. It’s common to see blocking if multiple operations are trying to update the same table – the first process essentially gains a lock on the table, and the second process sits waiting. Often, the batch can get into a loop, and neither process completes successfully, hence the deadlock. If processes are operating on the same records, the only way to avoid blocking and potential deadlocks is by rescheduling the processes so they don’t operate on the same records at the same time.
Database size
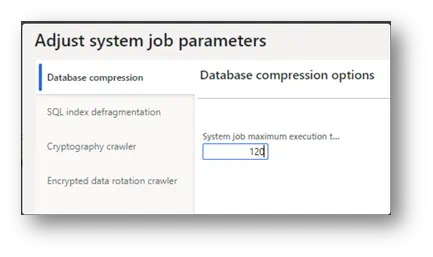
Database volume can grow very quickly in a large enterprise, requiring regular data management and re-sizing. Database compression offers storage reduction and better query performance. The benefits of data compression come at the cost of higher CPU usage for compressing and decompressing the data. Therefore, it is important to understand the workload characteristics on a table before deciding on a compression strategy. The feature is now introduced in the Finance and Supply Chain application that you can configure and run from the client.
Lifecycle Services (LCS) environment management
Lifecycle Services (LCS) is the monitoring and diagnostics portal for D365 providing a set of tools for an accurate view of your environments. Partner and client technical support teams are familiar with the performance monitoring telemetry published to LCS, and common feedback has been that it is sometimes difficult to successfully diagnose performance issues using the tools in LCS. Thus, Microsoft continues to create more reliable ways to collect performance metrics on demand. This is good news.
Environment Activity
The Activity tab on the LCS environment page provides a storyboard view that shows what you or another user was doing during a specific period:
- The User interaction chart shows a user’s activities on various machines in the environment and the SQL utilization trend
- The User load section shows all the system users, and each chart shows the time that the user spent on a specific machine
- The Activity load section shows the activities that were performed on each machine
SQL Insights
All SQL performance tools in LCS are available on the SQL Insights tab on the Environment Monitoring page for a specific environment.
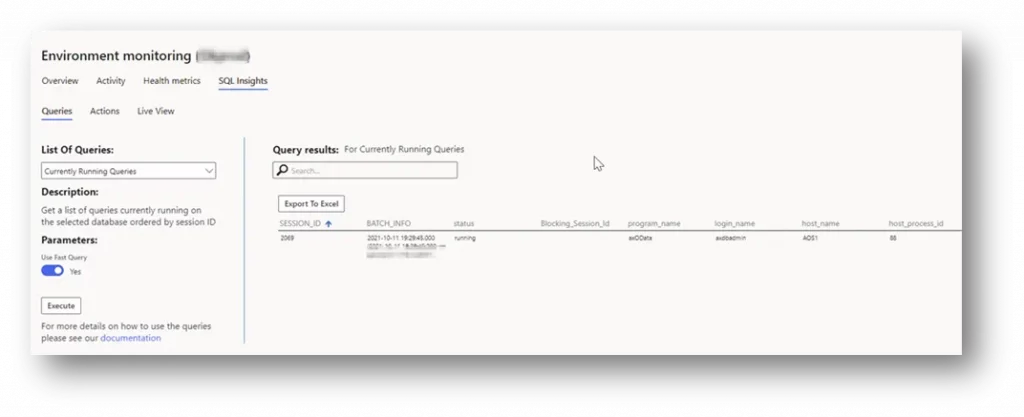
Here’s what is available:
- Queries – Shows a list of pre-defined queries that can be used to retrieve metrics on demand. Examples of queries includes a blocking tree, a list of the active plan guides, and a list of most expensive queries.
- Actions – LCS provides a predefined set of actions that can be used to mitigate issues in a sandbox or production environment. These actions query SQL Server directly, so you get query metrics in near real-time. Microsoft also added an audit trail on the action performed so that you can easily determine who performed the action and when it was performed. So anytime action is performed, say, rebuilding an index, environment history will show a record for the action performed.
- Live View – Shows the current DTU, blocking statements, and executing statements.
Updates and Fixes
The LCS portal has a helpful issue search function that allows you to look for additional performance-related updates that may apply to problems you’re seeing. You can use Issue Search to search a specific performance issue, and to see whether it has been resolved, is open, or has a workaround.
LCS provides further information regarding the major updates that are release twice yearly, as well as critical updates and hot fixes. Check regularly to see if there are any updates and hotfixes required, or if your environment has updates that have not been applied. While customers are allowed to be three versions behind the most recent release, one of those versions may contain performance updates that can fix an issue you’re experiencing, so it’s good to stay current with recent updates and fixes.
Environment Sizing
Issues may also arise if environments are undersized for the jobs they need to perform. This typically occurs because during implementation companies may not fully understand how they might expand use of the technology in the future, and size appropriately. For example, a company may deploy a basic Dynamics 365 system to perform core financial transactions, and after a few months expand it to add capabilities such as trade logistics, warehousing, or other functions ― placing an unplanned burden on the platform.
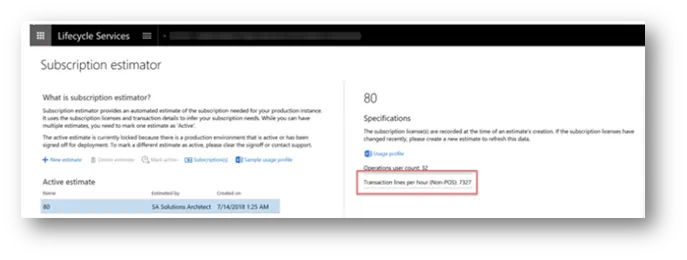
Similar performance challenges can result if companies miscalculate the expected business workload requirements for their Dynamics system once it gets up and running. To reduce this, Microsoft’s Subscription estimator tool can help estimate the transaction counts expected during periods of peak workloads. Based on your user licenses, modules, and transaction counts, the tool helps you calculate subscription requirements to ensure your provisioned environment meets your changing business needs.
Tools that can help
Trace Parser
Trace Parser can help identify performance issues including long-running X++ methods, time-consuming SQL queries, or client server calls. Trace Parser consolidates information from multiple sources, such as remote procedure calls (RPCs) and Microsoft SQL Server, to provide an integrated view of application performance for a process. Trace Parser not only measures code execution, but also provides information about database execution times and may indicate performance issues due to caching.
Optimization Advisor
Optimization Advisor is a relatively new tool that suggests best practices for module configuration and pinpoints business data that is obsolete or erroneous. The tool is designed to run a set of default best practice rules; however, you can also create rules that are specific to your organization’s customizations or solutions that include ISV code. Optimization Advisor then runs periodically in the background and identifies opportunities for optimization. When a violation of a rule is detected, an optimization opportunity is generated, and you can take corrective action directly from the Optimization Advisor workspace. Opportunities can be company-specific or cross-company, depending on the type of setup and data that is being validated.
Check here for more information about how to view opportunities and create rules for Optimization Advisor.
Performance Timer
Performance Timer is a lightweight tool that can help to determine why your system is slow. You can quickly get an overview of most performance issues by pressing F12 and working with the debugging tools that are available in your browser. The timer will show up there, and you can find information about any of the following performance counters:
- Garbage collection (GC) processes piling up on the server
- Open forms with opening/closing per second rates and counters for all forms created and closed
- Current web client sessions, idle and used
- Total number of sessions created
- Sorted SQL queries triggered by specific calls
For more specific directions about using Performance Timer, refer to the Microsoft information here.
Putting it together
This blog contains a host of information on monitoring and managing performance in D365 Finance and Supply Chain. We’ve also provided information and links to several auxiliary tools that can help pinpoint issues. The following table contains a synopsis of performance issues and approach:
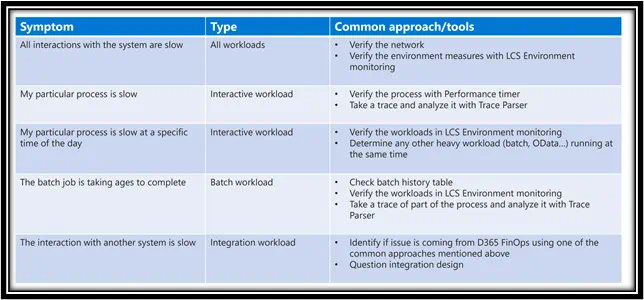
Performance monitoring and enhancement activities never go away. As discussed, there are many considerations on the front and back ends, and all are critical to optimizing and maintaining your Dynamics 365 platform over the long term. It’s a complex undertaking.
A partner may be in the best position to provide an administrative and technical assessment of your Microsoft Dynamics 365 performance and monitoring situation. In many circumstances, it makes sense to collaborate with an experienced Microsoft Dynamics 365 partner for resolving complex product issues. At Hitachi Solutions, we have the technical expertise and years of Dynamics experience working with our customers to become their trusted advisor, and long-term and reliable monitoring partner.
If you have any questions about this post or Hitachi Solutions, please contact our team. We would be happy to help you.