Using Power BI to give Santa insights to help Manage Elf Production and Delivery


Santa’s making his list and checking it twice.
He knows if you’ve been naughty or nice.
Santa’s main concern is making toys and distributing them in a timely and orderly fashion to children all over the world. How does he do it? He uses Power BI, of course.
With the magic of Microsoft Power BI, Santa can manage every child’s wish, every chimney’s location and even manage Elf production to ensure on time delivery on Christmas Eve.
With wishes coming in from Santa’s visits to shopping malls, letters in the mail and even emails, it’s difficult to bring all of the data together to make sure every child’s wish comes true. Once the wishes have been gathered, Elf production needs to manage inventory and production to make sure just the right amount of toys are made.
With Power BI, Santa and his E.L.V.E.S team, can gather data from anywhere and transform it in meaningful data to build interactive visualization. Santa can mash up the data, model the data, build a star schema, or add measures and calculated columns. He can visualize data with great range of data visualization elements and customize it to tell the story behind the data. Santa can publish his dashboard and visualization report in the cloud and share it with all the Head Elves. Power BI can work with on-premises data as well as Azure or cloud-based data sources, even connecting to Twitter so he can find out what people are saying about the North Pole. All giving Santa the insights he needs to make meaningful decisions.
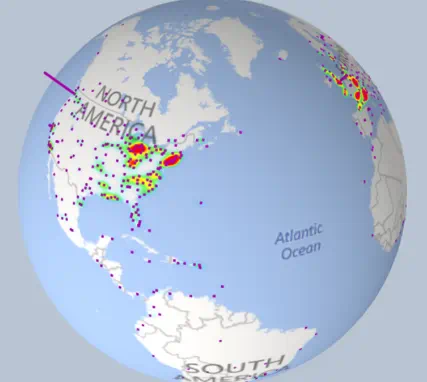
Once the routes have been planned and approved, Power BI converts this huge amount of data from vast sources into visual insights. This enables the E.L.V.E.S team to view globally all the places Santa needs to stop on his routes. They will instantly know when something needs their attention and solve problems as they occur.
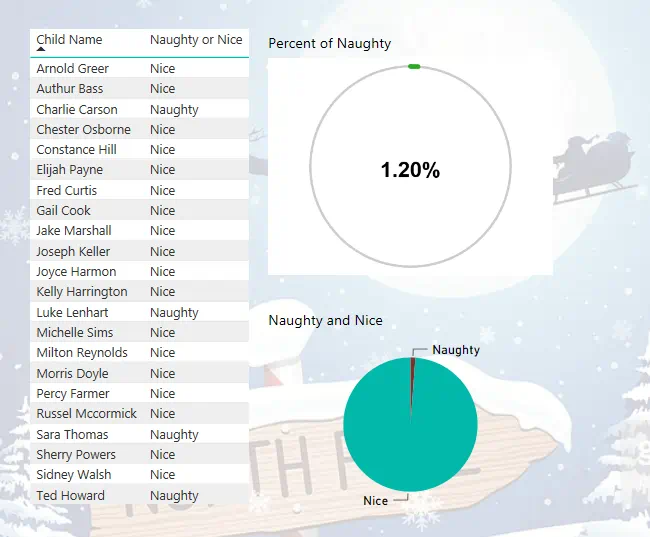
A big part of his job is to keep an eye on children’s behavior over the course of the year and if they’ve behaved well, there’s a good chance their Christmas wish will come true. If their behavior was less than satisfactory, however, there’s a risk of getting nothing but a lump of coal in their stocking.
In real time, Santa can view a visualization to show out of the 1.9 billion children in the world, who is naughty and who is nice.
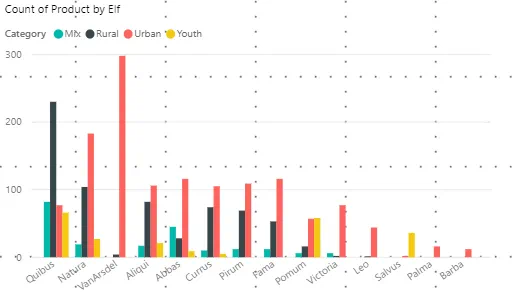
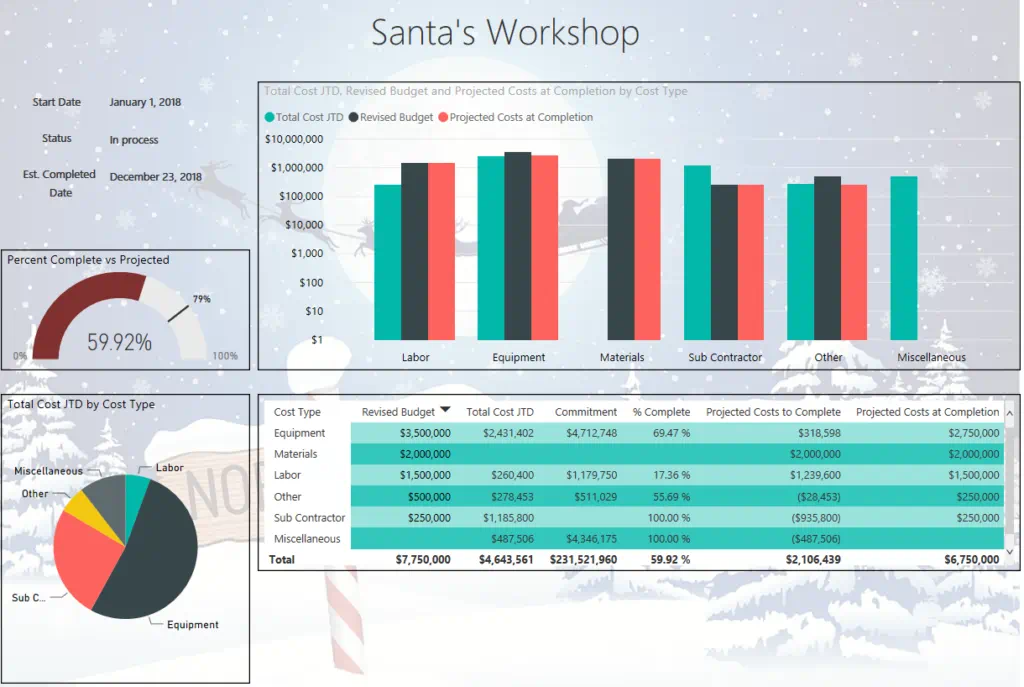
Santa can also track toy production to see how each Elf is doing all on an interactive dashboard that will provide real time updates, keeping things running smoothly. Santa can drill into a visual to get deeper insights into what is causing a change.
Power BI provides the ability to produce dashboards so that Santa and his team can stay informed, ask questions of the data and get answers all while ending the chaos as everyone is on the same page. The result is Santa can now make informed business decisions. These reports can be shared across multiple platforms and devices.
You can see how Power BI allows Santa, in real time, to manage all facets of the North Poles activities. Ready to add some Power BI magic to your organization? Contact Hitachi Solutions today!